COVID-19 Real Estate Market Update April 15-21, 2020
As always, in this post we are going to give you an update for the Mississauga Real Estate Market. However, I also want to explore the question, Is the Toronto Real Estate Market going to Crash?
Below is your real estate update for Mississauga for the week of April 15 – 21, 2020. The data has been based on MLS sales over the past week.
Mississauga Real Estate Market Update
Continuing the trend for last week, sales and new listings in Mississauga continue to remain extremely low when compared to the sae tie last year. Less homes for sale in Mississauga and less buyers was the story of last week.
- Listings were down 62% Year over year
- Sales were down 59% Year over year
- The good news is that the number of sales in Mississauga were 4 times higher than compared to the previous week.
As long as we remain in a state of emergency, sales will continue to remain historically low. However, I do want to point out that the increase in sales week over week could be looked at as a silver lining that there’s a light at the end of the tunnel for home sellers.
Home Prices
This is where things get a little more tricky and it’s not simply comparing average selling prices year over year. To get a better idea of what’s going on, you need to compare what has changed over the past month in real estate. All figures below are based on the sale of semi detached homes in Mississauga, from 600k to 900k. The numbers compare April 15-21 2020 to the first week of March 2020.
- Prices are till down approximately 9%
- Average days on market for homes that sold jumped up to 27 days
- Average sold to ask ratio was 99%
Not much change from last week in terms of selling price or average sold to ask ratio. However, average days on market did rise to 27 days, I totally expected given the market slowdown.
Normally in a market downturn where prices drop, you see the absorption rate increase, meaning there are way more homes on the market and the time it takes to sell goes way up. However we are still seeing very low levels of inventory, indicating to me the slowdown is psychological, and that most sellers are not under pressure to sell right now.
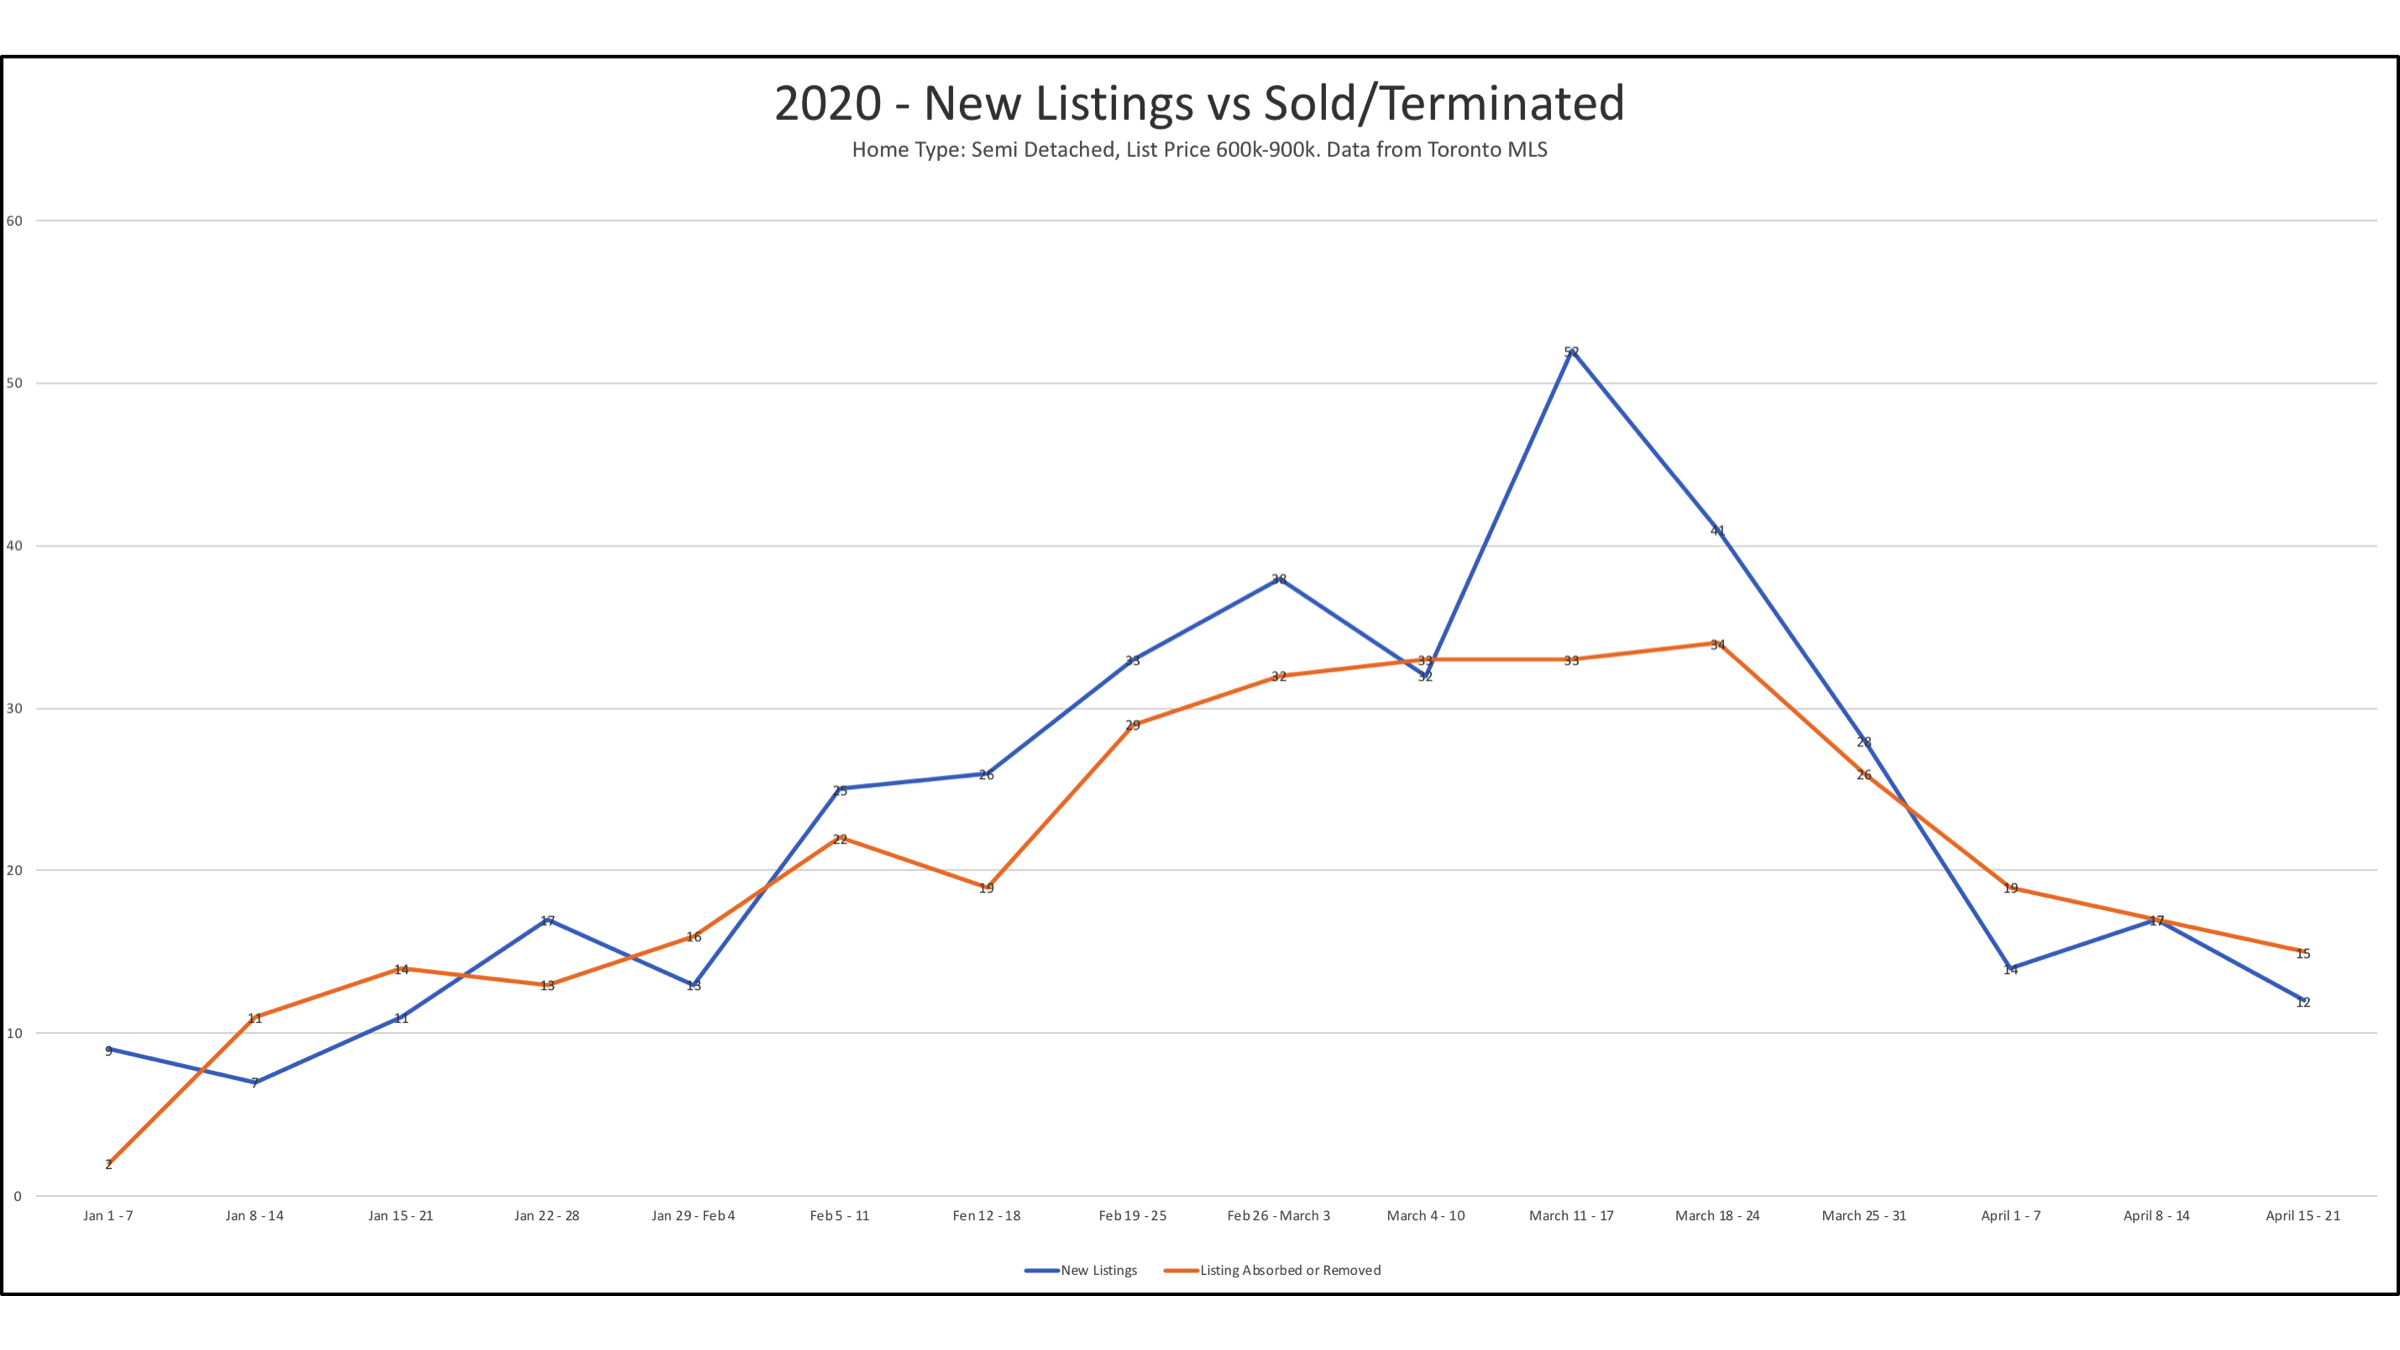
Comparing the number of new listings versus number of sold and cancelled listings. As you can see inventory levels remain close to the number of sales.
This is not the case in Mississauga at the moment. In fact listings continue to drop and homes are selling fairly quickly which tells me there are some nervous sellers out there that are pricing their homes aggressively low to the get the sale. This has benefited buyers looking for deals.
Is the Toronto Real Estate Market going to Crash?
While no one has a crystal ball, I thought it would be interesting to look at what might happen in the near future. To do this I have charts from the last 2 market downturns to look for clues as to what to expect.
April 2017 – Foreign Home Buyer Tax and Government Intervention
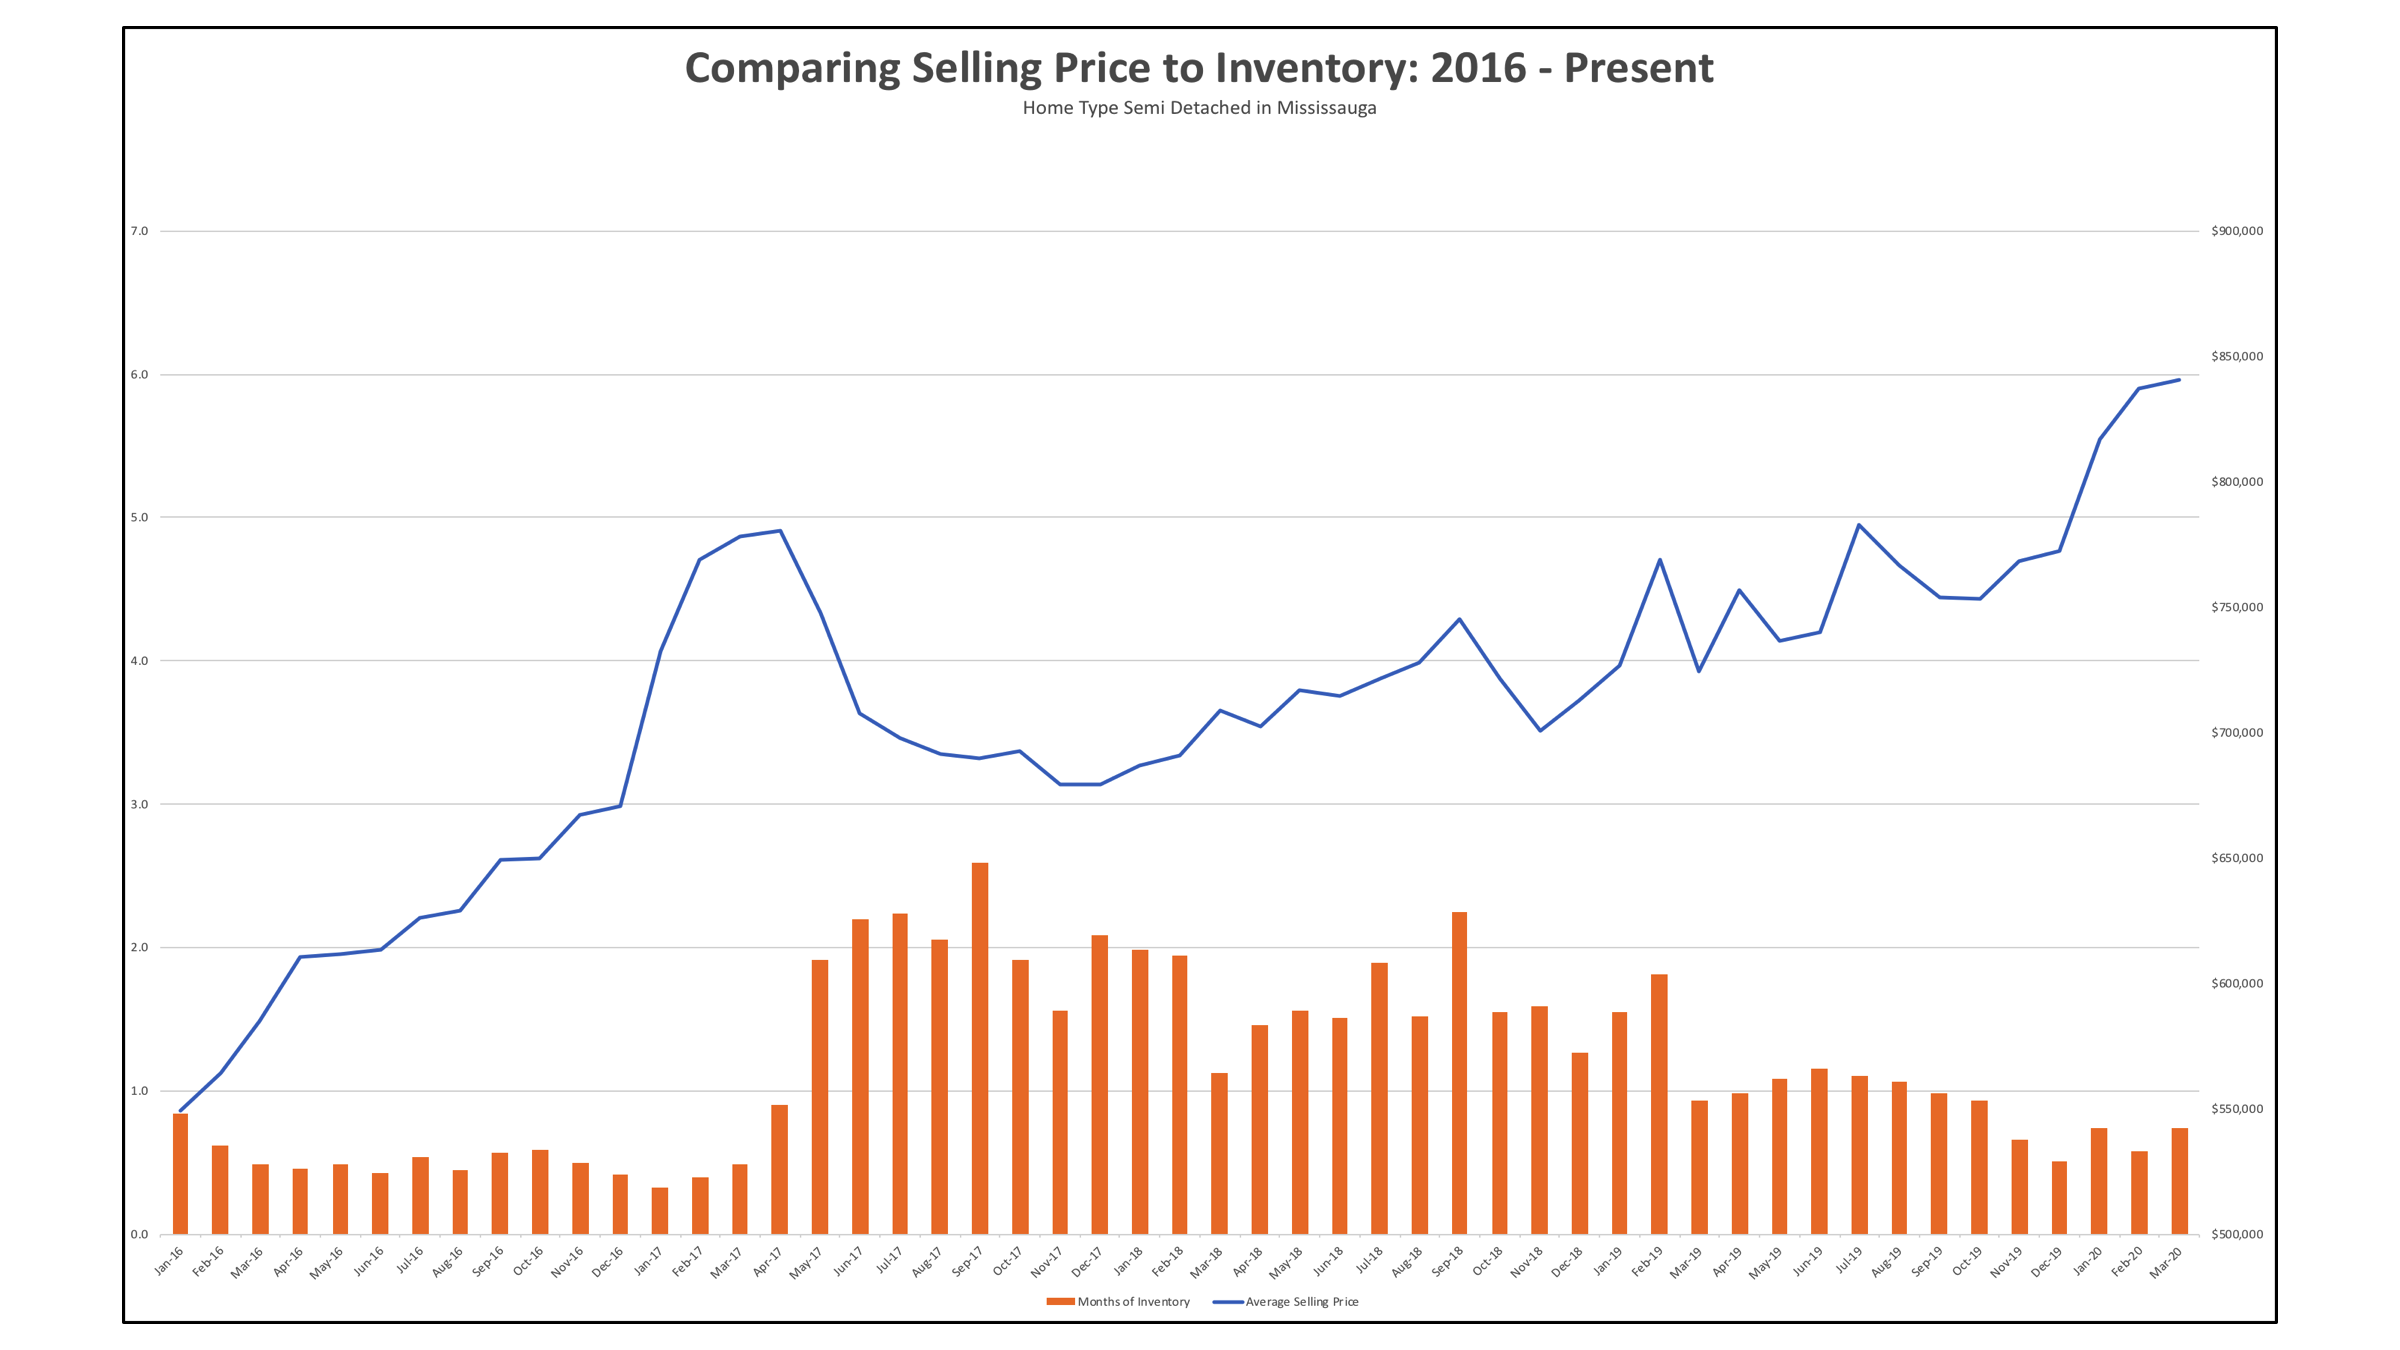
This chart compares the average sales price versus the amount of inventory on market on a monthly basis.
This chart plots home prices versus months inventory on the market. What you can see is a sharp increase in prices running up to 2017, followed by an equally steep drop right after.
While inventory did rise in April of 2017, it never got high enough that would have caused a severe price correction on its own. Homes never climbed over 3 months of inventory, which indicates it should have remained a sellers market.
This correction was a result of government intervention to combat rampant speculation and foreign investment in real estate. But it does show how powerful the psychological effect of a slowdown can have on home buyers and prices. However, due to low levels of inventory, the effect lasted only so long and home prices quickly rebounded.
If our economy quickly recovers, 2017 may be a good example of what to expect this year, with the impact on prices mostly due to consumer confidence.
2008 – Sub Prime Mortgage Crisis

This chart compares the average sales price versus the amount of inventory on market on a monthly basis during the Sub Prime Mortgage Crisis.
2008 Represents the most recent example of how an economic recession can affect housing prices. During 2008, home prices dropped across the board, and the amount of homes for sale skyrocketed into buyers market territory. This was due to a number of factors including systematic lending problems, a recession and lower consumer confidence.
What’s important about this chart is that is show a direct correlation between absorption rate and home prices. For 2020, keep an eye on the amount of homes for sale. If the number of homes for sale keeps rising but homes are not selling, that could signal a longer downturn in the housing market.
2020 Outlook
As it stands right now, it’s hard to predict what will happen. Based on the current inventory, I’m inclined to think that the moderate price drop is psychological, because inventory levels remain extremely low. The key here is how our quickly our economy recovers once the lock down is ended.
Find out what houses are selling for in your neighbourhood and get all of my market updates!
Stay safe!!