COVID-19 Real Estate Market Update April 8-7, 2020
Now in our 4th week of the COVID-19 emergency in Ontario, people are starting to wonder if this crisis will ever end.
While the provincial government did increase the state of emergency until the end of May, there are some slight signs we may have reached our peak which hopefully means over the next month we see a steady reduction in cases.
While there are any opinions on when and how COVID will play out, I think the vast majority of people agree that these next few weeks of continued social distancing will go a long way to helping us return back to some sort of ‘normal’.
Having said that, here is your real estate update for Mississauga for the week of April 8 – 14, 2020. The data has been based on MLS sales over the past week.
Mississauga Real Estate Market Update
Continuing the trend for last week, sales and new listings in Mississauga continued to drop. Less homes for sale in Mississauga and less buyers was the story of last week.
Comparing April 8-14, for both 2019 versus 2020 these are the raw numbers:
| 2019 | 2020 | % Change | |
|---|---|---|---|
| New Listings | 426 | 127 | -79% |
| # of Sales | 228 | 20 | -91% |
What’s obvious from this chart is that sales are down big time compared to the same week last year. However keep in mind that this is due to the extreme social distancing measures and buyers choosing to delay house hunting. In order to get a true sense of what’s going on and what might happen in the future I’ll dig further into the numbers below.
Home Prices
This is where things get a little more tricky and it’s not simply comparing average selling prices year over year. To get a better idea of what’s going on, you need to compare what has changed over the past month in real estate. All figures below are based on the sale of semi detached homes in Mississauga, from 600k to 900k. The numbers compare April 8-14 2020 to the first week of March 2020.
- Prices have dropped 8.5%
- Average days on market for homes that sold were only 9 days
- Average sold to ask ratio was still over 100%
So I must admit, these numbers are very interesting. Normally in a market downturn where prices drop, you see the absorption rate increase, meaning there are way more homes on the market and the time it takes to sell goes way up.
This is not the case in Mississauga at the moment. In fact listings continue to drop and homes are selling extremely quickly which tells me there are some nervous sellers out there that are pricing their homes aggressively low to the get the sale. This has benefited buyers looking for deals.
Market Snap Shot
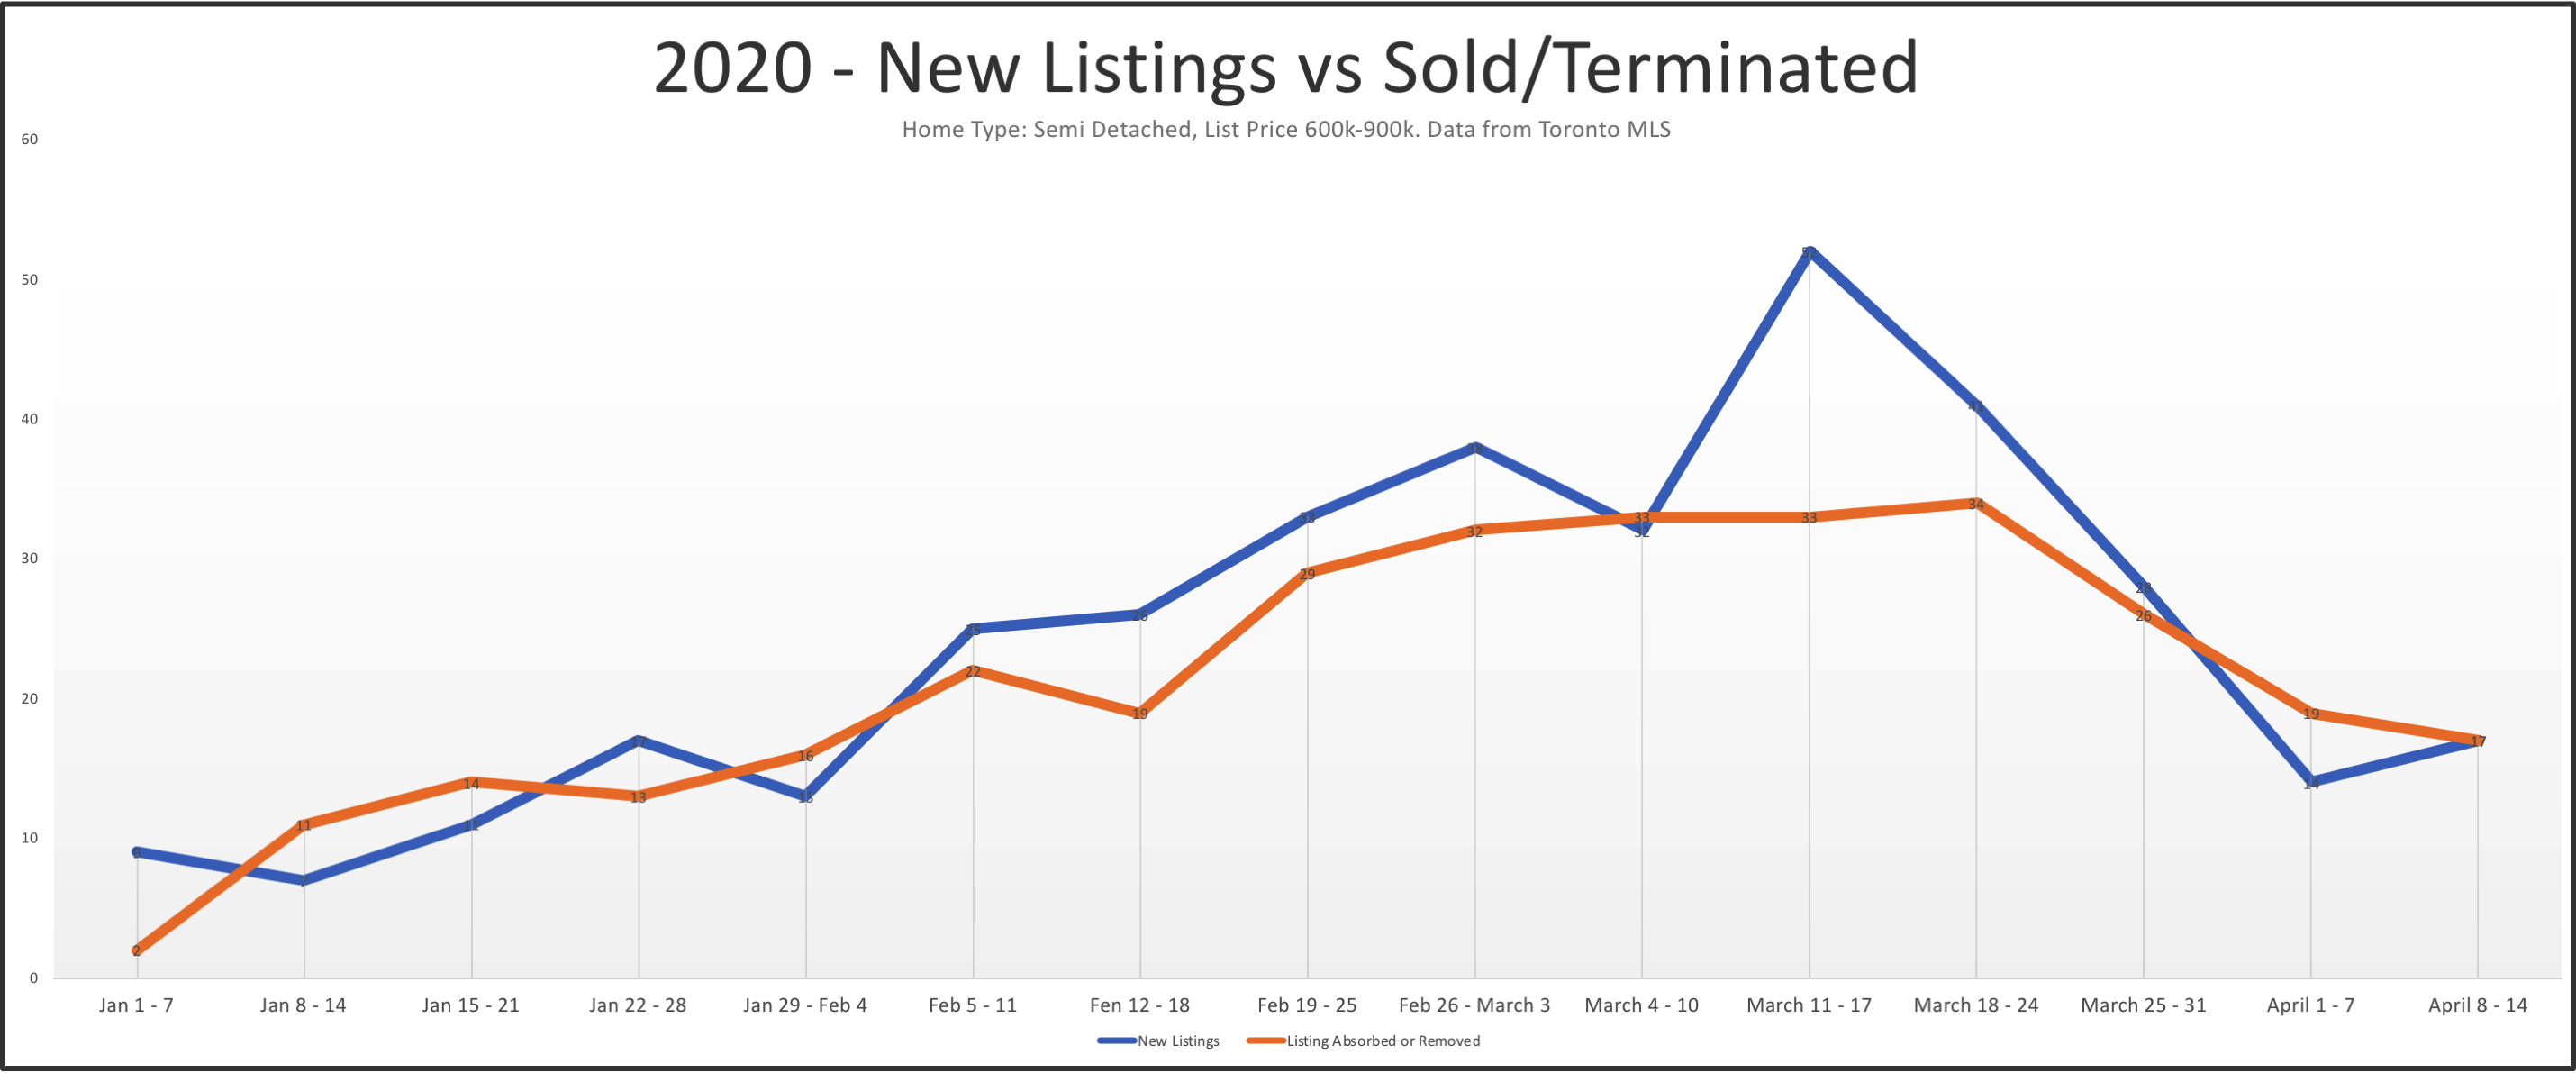
After experience a slight upswing in listings mid March, the supply of homes for sale has dropped. This reflects the fact that the majority home sellers are choosing to wait the current market out. Low Supply levels reduces the chance of a severe price correction. For more information see this article on Absorption Rate.
(Image below: Blue line represents new listings, Orange line represents sold or terminated listings. All numbers based on sei detached home sales in Mississauga as reported on Toronto MLS system.)
From January 1 to mid March: Supply was short and prices were climbing, this is reflected in the the narrow gap between new listings and absorbed (sold and terminated) listings.
Stay tuned for my next update and if you need to buy or sell during this time, we are still working. I’m happy to schedule a time to discuss strategy and safety precautions to get you where you need to go!
Stay safe!!


